IOC monitoring using the Elastic stack
How to use Elastic security to effectively monitor for Indicators Of Compromise
4 March 2021
What are we trying to prevent?
This post aims to explain how you can use the Elasticstack's capabilities combined with a tool I wrote to monitor for known indicators of compromise
Imagine this...
It is Tuesday afternoon, everyone is packing their things to go home after another day at the office and you are called by the CISO; someone is threatening to leak data from your company on the dark web unless they are payed in bitcoin, to prove they are in your systems they will encrypt (ransom) hundred random servers; ten minutes later 100 servers go down.
Three months later, this has passed (you can imagine the possible scenario's) and an investigation by an independ third party points out that three weeks before the call, your systems we're breached and malicious files had been placed throughout your environment, communication with a C&C server took place and this could have been detected as the ip's and file hashes we're available in publicly available threat lists but your team didn;t have the monitoring in place to detect it.
Disclaimer
Following this setup does in no way guaruantee detection and/or prevention of malicious and/or unwanted activity. I take no responsibility and can not be held liable for anything.
Getting the data
In order to be able to monitor for IOC's you'll first have to get the correct data from your environments into elasticsearch. In this case I will use auditbeat to monitor file's and packetbeat for network information, the goal is to know which files are created and their propeties as well as data on what network connections are made; The latter can also be done by using netflow data for example.
Auditbeat
Auditbeat has a file_integrity module which can provide us with the first piece of the puzzle: "file data"
The module supports both linux, MacOS (Darwin) and Windows at time of writing and configuration is relatively simpel. For our purpose we will monitor some best practice directories as well as "user" directories in a linux and windows environment.
Example Linux configuration
paths:
- /bin
- /usr/bin
- /sbin
- /usr/sbin
- /etc
- /home
exclude_files:
- '(?i)\.sw[nop]$'
- '~$'
- '/\.git($|/)'
scan_at_start: true
scan_rate_per_sec: 50 MiB
max_file_size: 100 MiB
recursive: true
Packetbeat
The configuration on what ports to listen will depend on you system, however make sure you enable flows as this will log more network data then just the protocols and ports specified which is crucial for IOC monitoring
Ingesting IOC data
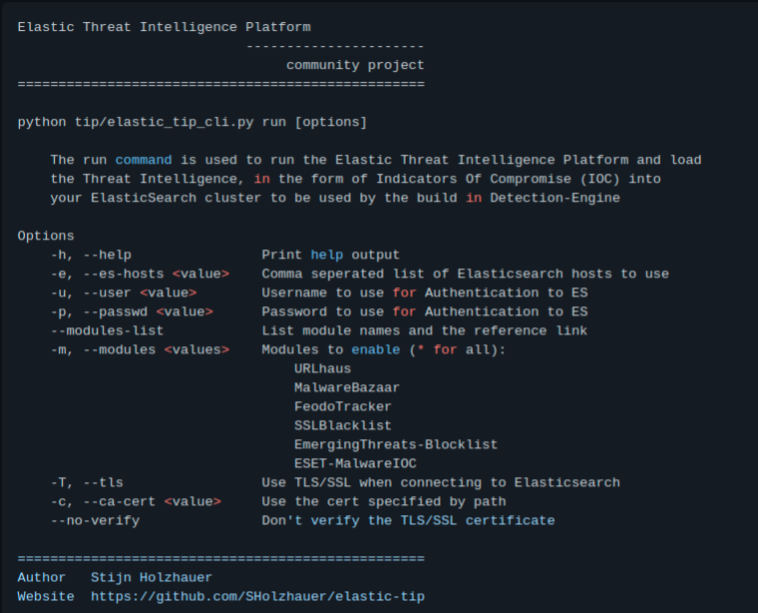
Now we have the data from our environment we need data to "match it against" to know if we have IOC's in our environment. To do this I have written a tool in Python which will collect IOC data from multiple sources and ingest it into Elasticsearch. You can find the tool on https://github.com/sholzhauer/elastic-tip
Running the tool will allow you to automatically retrieve data from multiple threat feeds and ingest it into elasticsearch in Elastic Common Schema format; I recommend running the tool daily to keep your data up to date.
Building detections
By this point you have all the data required to monitor for file and network IOC's; To monitor elastic provides a build in feature called detections which we'll use to perform IOC matching.
Create a new detection rule
Open up Kibana and navigate to the detections app, here select manage detection rules and create a new rule.
Build the file hashes rule
For rule type select the indicator match option, for index pattern's select auditbeat-* and use the query: file.module:file_integrity
Set the indicator index patterns to elastic-tip
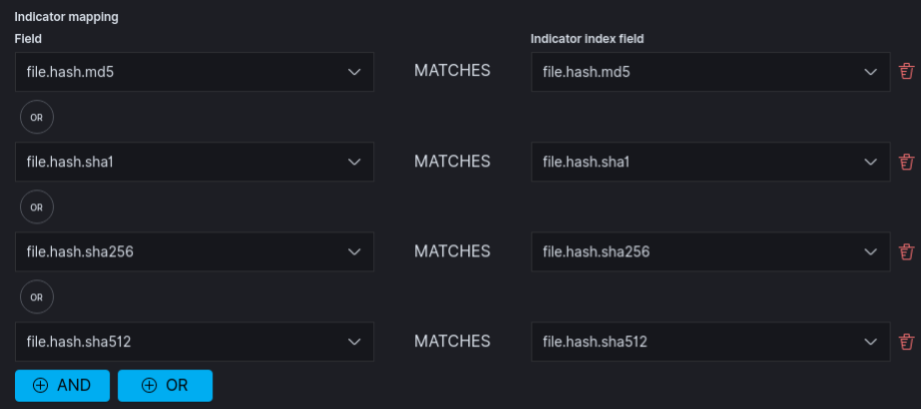
You will now match file integrity data against all IOC data, now add the indicator mapping by mapping each file.hash.x field (md5, sha1, sha256, sha512) to their counterparts in the elastic-tip index
Finish the rule properties to your liking
Build the ip rule
Repeat the above
- map destination.ip to the threat.ip field.
- Use destination.ip:* as query
You could also map source.ip, client.ip and server.ip to the threat.ip fields but depending on your environment this can create a lot of FP's due to the nature of these malicous ip's. Namely public endpoints will consistently be scanned. Play around a bit with these mappings to find what is suitable to your environment.
I have added two example detection rules in the elastic-tip repository which you can use. They are build using elastics detections repository and TOML formatted.
Benefit!
At this point you have created monitoring on IOC's in your Linux and Windows environments which will automatically scale to new IOC data as well as new hosts as long as they get the auditbeat & packetbeat configurations.
Coming back to the example scenario with which I started; You now have the capability to detect malicious files and communications when they occur (three weeks before the call).