Log event management in the Elastic stack
Log parsing and Elastic Common Schema
It is a marathon, not a sprint
06 February 2020
The Elastic stack can be used for a multitude of things where using it to monitor time series data is probably one of the more known ones (but most likely not the most used one). In enterprise sized environments managing the amount and diversity of log events can be a challenge. In this post I’ll go over the tools, strategies and things I have learned in the past three years of both managing a cluster and building security monitoring on top of that cluster.
Why is log management important
Log management can be important for a wide range of reasons, to the efforts I’m involved in on a day-to-day business for example some of the reasons are compliance, development, and security monitoring. In general log management is important to enable the use of log events in an effective and standardized way.
Log management means you are maintaining the flow of log events to make sure the use-cases for those log events are possible. Without log management you’ll end up with a bunch of data which is barely usable.
What is log management in the Elastic Stack
As I wrote, log management is maintaining the flow of log events. In the Elastic stack this translates to roughly three tasks:
- Setting up and configuring log inputs
- Writing log parsing for the events coming in
- Index management
Index management is a subject which deserves dedicated attention, the other two i’ll explain in this post.
Setting up and configuring log input
There is nothing to manage if no events are “ingested”, you need to configure something to either pull or push your log events from your environment into the Elastic stack. There are three methods available to you to accomplish this:
- Use one of the beats to ship the data from an endpoint to your cluster.
- Configure logstash to ingest the data
- Configure another tool to send the events
Setting up these is well covered by others and not the focus of this post. I’d recommend having a look at X or X for this subject.
Writing log parsing
Assuming your events are being send to your cluster you know have “raw” events, nothing fancy just a single blob of text (in the message field). In order to make the events truly usable the information in those single text blobs need to be extracted into other “fields”. This process is log parsing. As I’ll touch upon below there are two flow through which data can end up in Elasticsearch, either through logstash or (more directly) elasticsearch itself.
In either of these points the events need to be parsed into a format which makes the events usable, in the Elastic stack the standardized format of events is called Elastic Common Schema and the goal is to have information always contained in the same field. This will enable the usage of a lot of out-of-the-box functionality too!
Some of the tools & architectures out there
Elastic architectures can become complex, existing out of tens (if not hundreds) of different “tools”, however this does not mean the stack is difficult to use (on the contrary actually).
The Elastic Stack itself provides 99% of the tools required to accomplish 100% visibility into your environment: Beats, Logstash, Elasticsearch, Kibana; And in the past year Elastic has made a great effort to both standardize these tools and decrease the effort required to maintain them as well as increase out-of-the-box functionality.
The classic flow
Classically there are endpoints (servers, laptops, desktops, etc) in an IT environment which produce log events (spoiler, OS doesn’t matter). To get those events the best (subjective) approach is to install the beats on them and configure them to use the modules and ingest nodes. This will ingest & parse the events for you without having to write any parsing yourself, (where modules are available ofcourse).
For anything on which you cannot install software but you can reach remotely: logstash, it’s the “swiss army knife” of the stack and I haven’t come across a situation where it couldn’t solve the problem. (Databases, cloud services, SAAS, etc)
My recommended strategy
Up until here, this blog post has been a vague overview of what the stack does and what it consists of. Now we get to my answer to the question:
How should you manage your logs in the Elastic Stack?
In the complex, ever changing environments of today it is IMPOSSIBLE to get it right the first time. Trust me, get it between your ears (this took me about a year), log management is a continuous process and getting it complete and right will take years.
Starting from scratch?
The one advice I would give you; Make sure ery event ingested is ECS compliant and use as many out-of-the-box tools/modules/scripts of the Stack. Take it slow, pick up one source at a time and work your way through them.
It’s rarely from scratch!
Rarely we get to start from scratch, in my own case we had been using the stack since version 1.7 (roughly 7 years) and ECS had only recently become a thing, on top of this it wasn’t just security using the stack, the development teams we’re using it as there monitoring and debugging tool which meant we had heaps of “duplicate” fields, custom scripts, out-dated maintenance mechanisms, etc, everything you find in tools which have been used for a long time. So, how do you approach this?
I’m going to give you a list of steps which I now would say is how to approach this, so again, subjective:
- Get the back-up mechanism working and out-of-the-box.
- Validate and configure the index mapping
- Copy any field to their ECS counterparts
- Get the ecs used fields to be the actual ecs fields
Get the back-up mechanism working and out-of-the-box.
Before you go in and start changing stuff, get two “back-up” mechanisms in place, one is for you data which can be done using the snapshot functionality. This makes it a breese to have backups of the data and restore them.
The second one (which for me was already taken care of) get the setup of your cluster in a backup/redeployable state. What I mean by the second one is get the architecture, deployment, configuration files, templates, policies etc into a version control tool and use an orchestrator (e.g Ansible or Gitlab CI-CD) to deploy them.
Once in place: TEST THEM!
This is crucial! Seriously don’t skip this step, making an f-up and only having to `git revert` takes so much stress away from this process.
For the orchestration elastic does provide Elastic Cloud which can be worth looking into.
Validate and configure the index mapping (& templates)
Next step is to get the current index templates and field mappings into version controlled files. This is as straightforward as copying them from elasticsearch into json files.
The second part of this step is a bit more tricky, getting the data types for all your field correct and making sure the non conflicting ecs fields are properly mapped. You might also want to look into shard allocation etc.
The goal of this step is to have your current fields always be the same data type and prevent events from accidently picking the type for you for ecs fields which aren’t currently in use while you go through this process. Keep in mind it’s likely to run into conflicts, for example the following, on the left your a snippet of your current mapping and on the right the ecs snippet on the conflicting field.
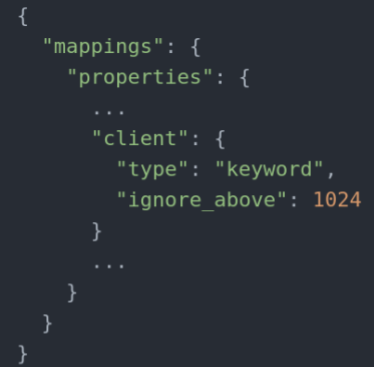

The problem here is, right now your client field is a single field containing text. To ECS client is an array of fields in which a.o. the client.ip field is housed, now what?
I solved this by splitting up the index templates into three components:
- Index settings
This file contained the “settings” part on an index template and has a priority of 0 - Default mapping
This file contained the default mapping of the index (can be exported from a beat) and has priority 1 - Overrides
The overrides file is the custom part, it has a priority of 2 and contains the mapping for all conflicting and custom fields.
So what you see in the right image ends up in priority 1 and in the left image in priority 2, thus overriding the ECS one.
Bonus tip: to make life easier later, document your conflicts!
Copy any field to their ECS counterparts
Right now you most likely have lots of custom fields, probably even duplicates (e.g. username and user_name housing the same info) and probably most of them have an ECS counterpart which doesn’t have a conflict at the moment. So let’s copy them!
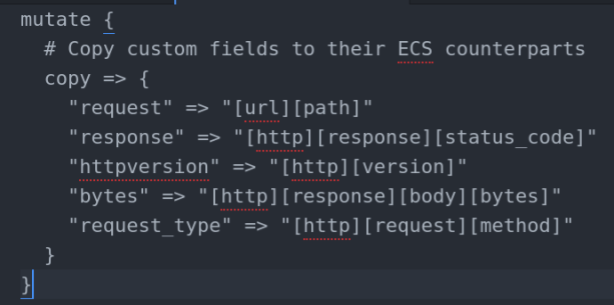
This step is done by updating your logstash and/or ingest node pipelines to copy the custom fields to their ecs counterparts. This is a time consuming process and you won’t get everything in one go. Take it step by step, source by source.
This step is completed once you are satisfied with the progress made, probably missed one or two sources, but they will show up at some point, might as well deal with them then.
Example of how copying fields across in logstash could look like:
Get the ecs used fields to be the actual ecs fields
At this point, I had done roughly 95% of the conversion to ECS, remaining 5% were conflicting fields, however I was only able to use 30-40% of the out-of-the-box functionality (in my case the Security app) because those 5% were essential fields (e.g. source, user, http) fields.
The goals here is to remove all conflicts and get all ECS fields usable, to do this take the conflicts and basically inform the users of the stack, the people who query the data, build visualizations and dashboard or have integrations with elasticsearch and tell them something along the following lines:
Hello everyone,
In order to get the stack in a more usable state we are standardizing a lot of fields by using Elastic Common Schema, non conflicting fields will remain to exists but the following conflicting fields are going to be updated, please make sure by
Once you send the email, update the log parsing. Get all the conflicting fields to be renamed to their ECS counterparts or a new custom field (Try capitalizing the new fields to prevent future conflicts), do so on a feature branch to prevent the changes from deploying immediately. Bit depending on your setup but also remove all the conflicts from your override template (the one with priority 2), keep in mind these templates have to be deployed before you deploy your pipeline changes.
Once you arrive on the date, merge and deploy your changes, we make use of a buffer mechanism so I stopped the pipelines from parsing events, had the buffer fill, manually rolled over the indices (so they used the new templates) and started the pipelines again.
You are now at a point where you are ECS compliant (no conflicts) and can use most of the OOTB functionality.
ECS compliant now what?
Alright 50% blog post on log management, 50% on getting to ECS compliant indices. What is this post about?!
Getting ECS compliant was the biggest job of log management for me, once this was done I got to the continuous part of log management. So this post is about both, and my advice at the point once you are ecs compliant is the following:
When you come across custom fields for which ecs fields exist, events without the “event” fields of ECS in them or any other improvements you can see (parsable fields for example) pick them up when you come across them. Don’t try to get them all at one go, it is a marathon, not a sprint.
Useful queries
When in the continuous process the following queries can be helpful in finding events which can be improved, they are all in KQL.
- source.ip:* and not source.geo.*:*
Looks for source.ip fields which haven’t been enriched with geoip information - not event.category:*
Look for events which don’t have a category field. - not event.dataset:* or not event.module:*
Look for events without a module or dataset field, these are really useful to see how your data is made up. - not ecs.version:1.7.0 (or most recent)
Find events which are not using the latest schema.
HELP!
If you need any help, have questions, etc the elastic community is an open one. Try joining the Elastic community slack and ask your questions there.